Preliminary Analysis of 6th Year Plantation Data
Alison Bower, 1998
The HSC now has 11 Type 2 installations that have had their 6th year measurement (out of the total of 26); this is a bench mark for us and provides the first real opportunity to look at the effects of our initial spacing treatments on tree growth. The summary presented here is elaborated in more detail in a Coop report dated July, 1998.
This analysis uses only the four control plots - one at each of the four initial densities (100,230, 525, 1200 TPA) and only 9 of the installations. One installation was dropped because it suffered significant ice and wind damage so its size does not reflect our treatments. The second omission was accidental; its inclusion would not materially change these conclusions.
This first set of analyses examined the relationships between a tree characteristic (quadratic mean diameter (mm), height (m)) and two independent variables: stand density (trees per acre) and site index (m). We calculated plot means for tree characteristics for 1) all the trees on a plot and 2) the 100 trees per acre with the largest diameter.
Four regression equations were developed:
All trees:
- DBH = 236.9 + 2.9SI50 - 40.7log(TPA): r2 = 0.81
- HGT = -170.9 + 19.4SI50 + 67.2log(TPA): r2 = 0.45
100 largest trees per acre:
- DBH = 49.3 + 4.6SI: 50 r2 = 0.19
- HGT = -285.5 + 17.8SI50 + 111.4log(TPA): r2 = 0.56
We normally think of stand density having a large influence on diameter. The first equation does show this; the log of trees per acre has a strong influence on stem diameter, larger than the influence of site index. When only the 100 largest trees per acre are examined, however, the effect of stand density is not significant. The mean diameter of these larger trees does not appear to be affected by the density of its neighbors. This suggests that alder does a better job of canopy stratification than expected. Site index does account for some of the variation among the 100 largest trees.
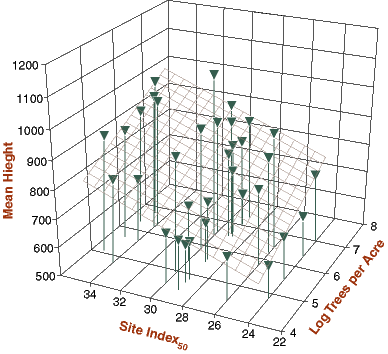
Height is usually thought of as being relatively independent of stand density. The first height equation seems to contradict this rule of thumb: stand density does explain a lot of the variation in height. The coefficient for log (TPA), however, is positive, indicating that height increased with stand density. For the largest 100 trees per acre, stand density is still an important explanatory factor, even more important than for the whole population of plots. Site index also continues to be an important explanatory variable.
Figure 2 shows an interesting interaction between density and site index. The effect of density is quite strong at low site index. At the highest site index, the effect has weakened considerable; the points plotted above site index of 34 seem to show only a slight density effect on mean height for all trees.

Studies of density effects in young stands of red alder and Douglas-fir elsewhere have shown a maximum height growth at intermediate densities (Knowe and Hibbs 1996, Scott et. al. 1992). We see the maximum height at the greatest densities. These two statements may not be at odds; for the size of our trees, 1200 TPA may be an intermediate density. Alternatively, our study design may just not be appropriate to pick up the phenomena. For example, our density intervals are large so our study design may not be sensitive to this phenomena.
This second set of analyses examined the relationships between tree quality characteristics (deviation, forks, lean, and damage) and stand density. We used individual tree characteristics (not plot means) for 1) all the trees on a plot and 2) the 100 trees per acre with the largest diameter.
Deviation is a measure of the sweep in the lower stem. It is measured in inches as the distance between the trunk and a 9 foot pole placed against a trunk with its lower end 1 foot above the ground. Forks are forks in the trunk. Lean is the angle in degrees of a line connecting the stump to the tip of the tree. Damage is evidence of any of several kinds: weather, animal, human, insect, disease, and other.
Table 2 shows that only the incidence of forking is affected by density, with lower incidence of forking occurring at high densities. A surprise is that there is no difference in incidence of any characteristic between the total population of stems and the 100 largest per acre. Our initial expectation had been that the larger trees would have scored better than the average tree on most of these characteristics. This result suggest that thinning regimes that simply favor the larger trees will not improve stem quality in terms of these 4 characteristics.
Treatment | Deviation | Forks | Lean | Damage |
|---|---|---|---|---|
All Trees | ||||
1 (100 tpa) | 22 | 22 | 14 | 15 |
2 (230 tpa) | 23 | 20 | 13 | 16 |
3 (525 tpa) | 24 | 14 | 11 | 14 |
4 (1200 tpa) | 31 | 13 | 13 | 22 |
Largest 100 TPA | ||||
1 (100 tpa) | 23 | 22 | 15 | 15 |
2 (230 tpa) | 27 | 20 | 11 | 15 |
3 (525 tpa) | 22 | 12 | 11 | 15 |
4 (1200 tpa) | 25 | 12 | 11 | 19 |
Table 2. Pecent of all trees and of largest 100 trees per acre for each of four wood quality measures | ||||